Slice data with multiple dimensions
This article lets you easily navigate the tools required to create a customized report, set filters, and explore additional data.
CREATE A CUSTOMIZED REPORT


Offers Carousel
-
-
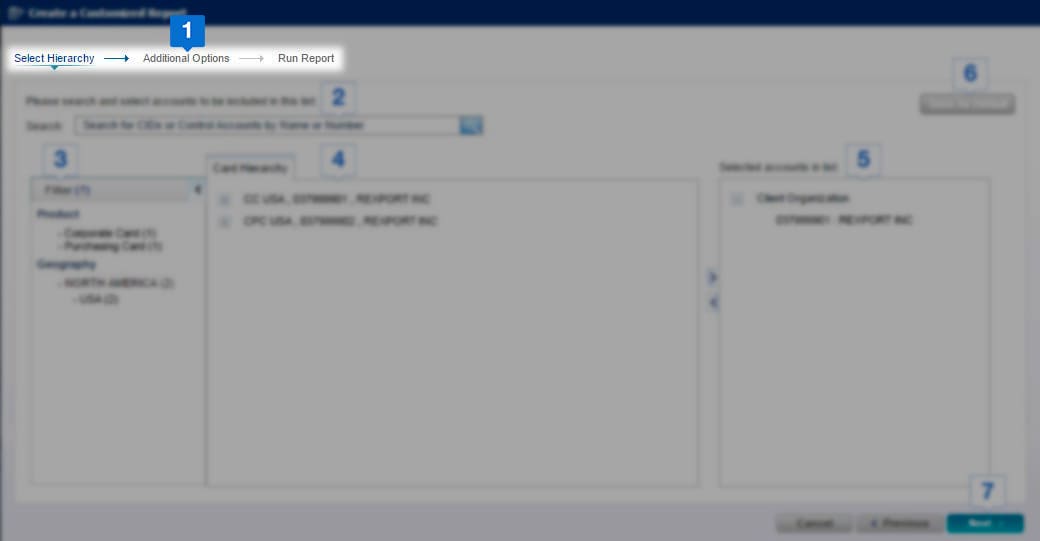

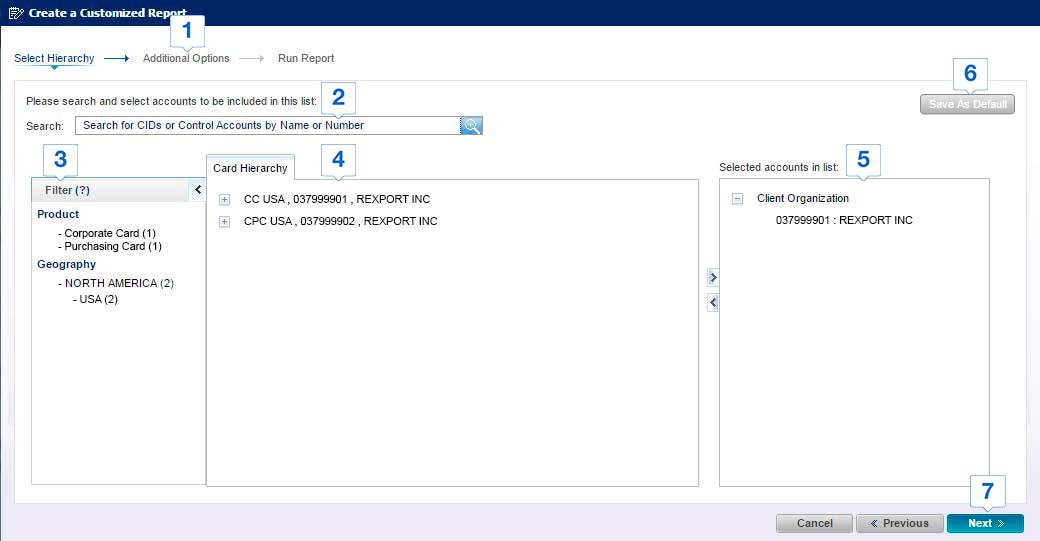
The navigation path on the top of the screen lets you know where you are in the setup process.
-
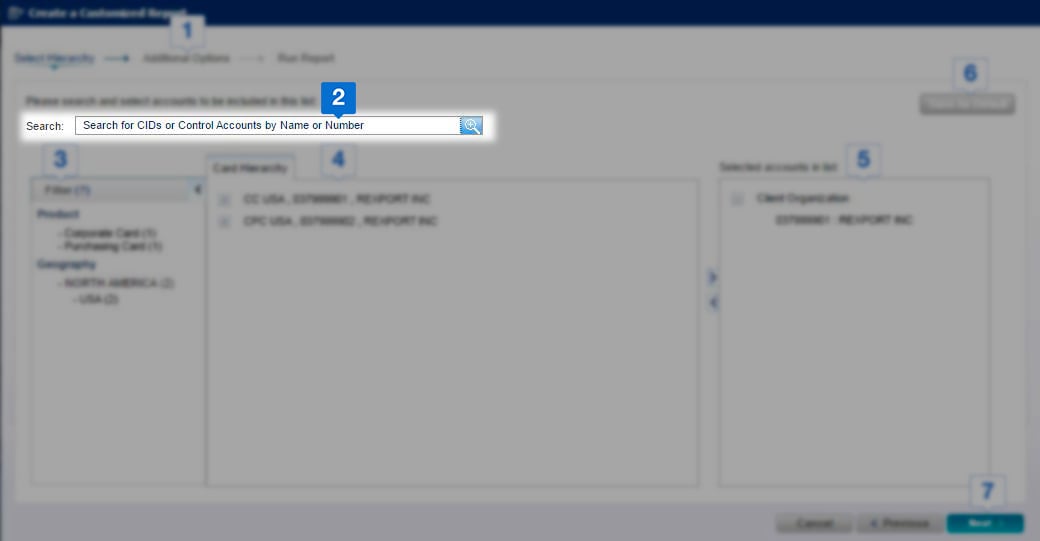

Enter a program hierarchy name or number in the search field to find the desired hierarchy for your report.
-


Use filters to search specific types of program hierarchies.
-
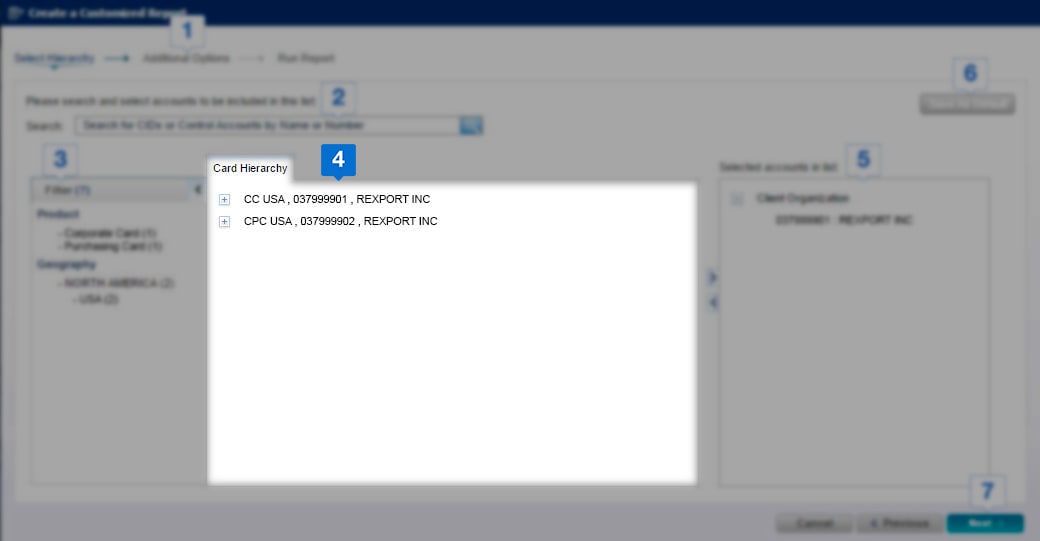

Select the desired hierarchy or hierarchies. Click the right arrow icon to move your selection to the right side of the screen. Hold the shift or control keys to select multiple items.
-
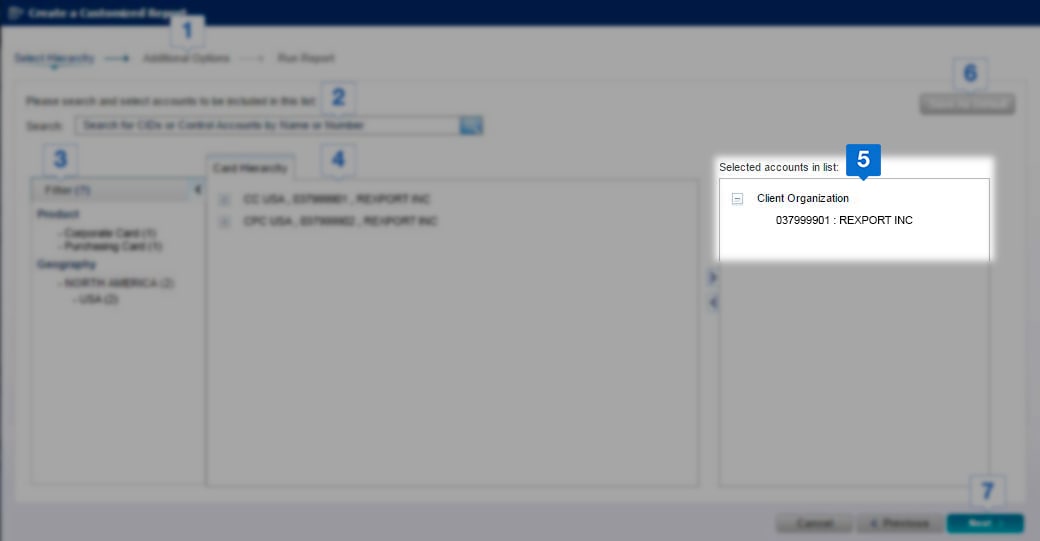

Your selection will appear here.
-
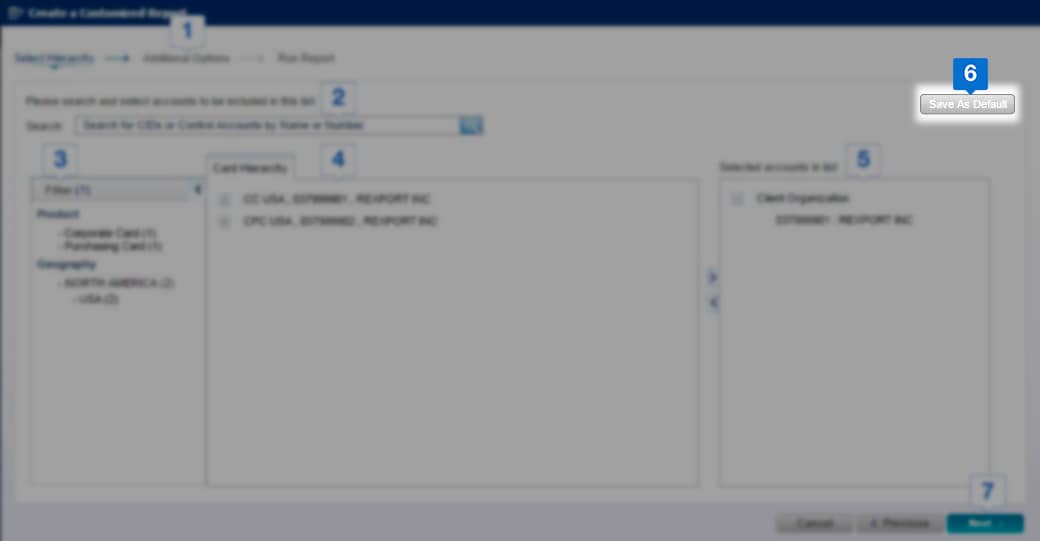

To save this hierarchy selection for future reports, click the Save as Default button.
-
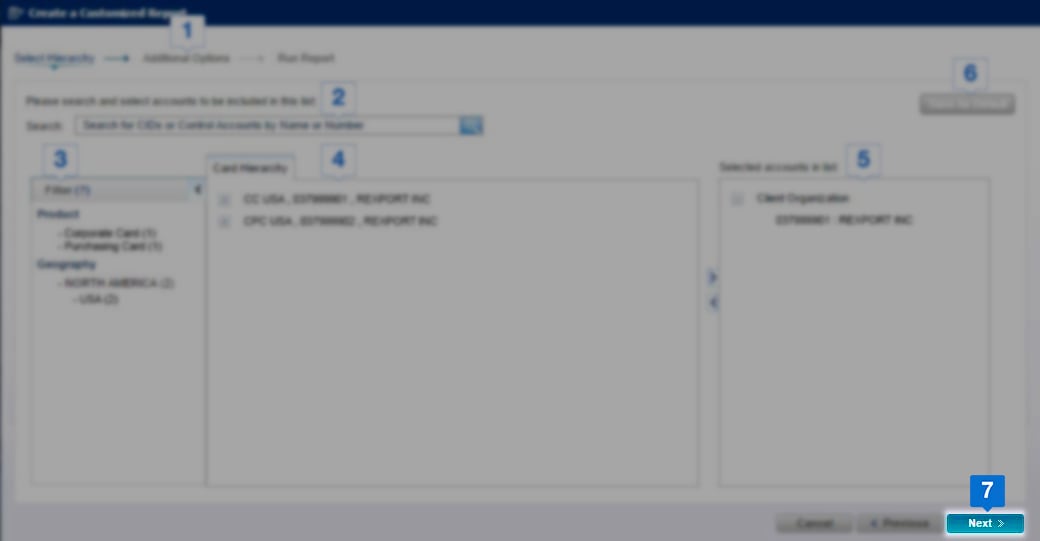

Click Next to continue with the setup process.


Offers Carousel
-
-
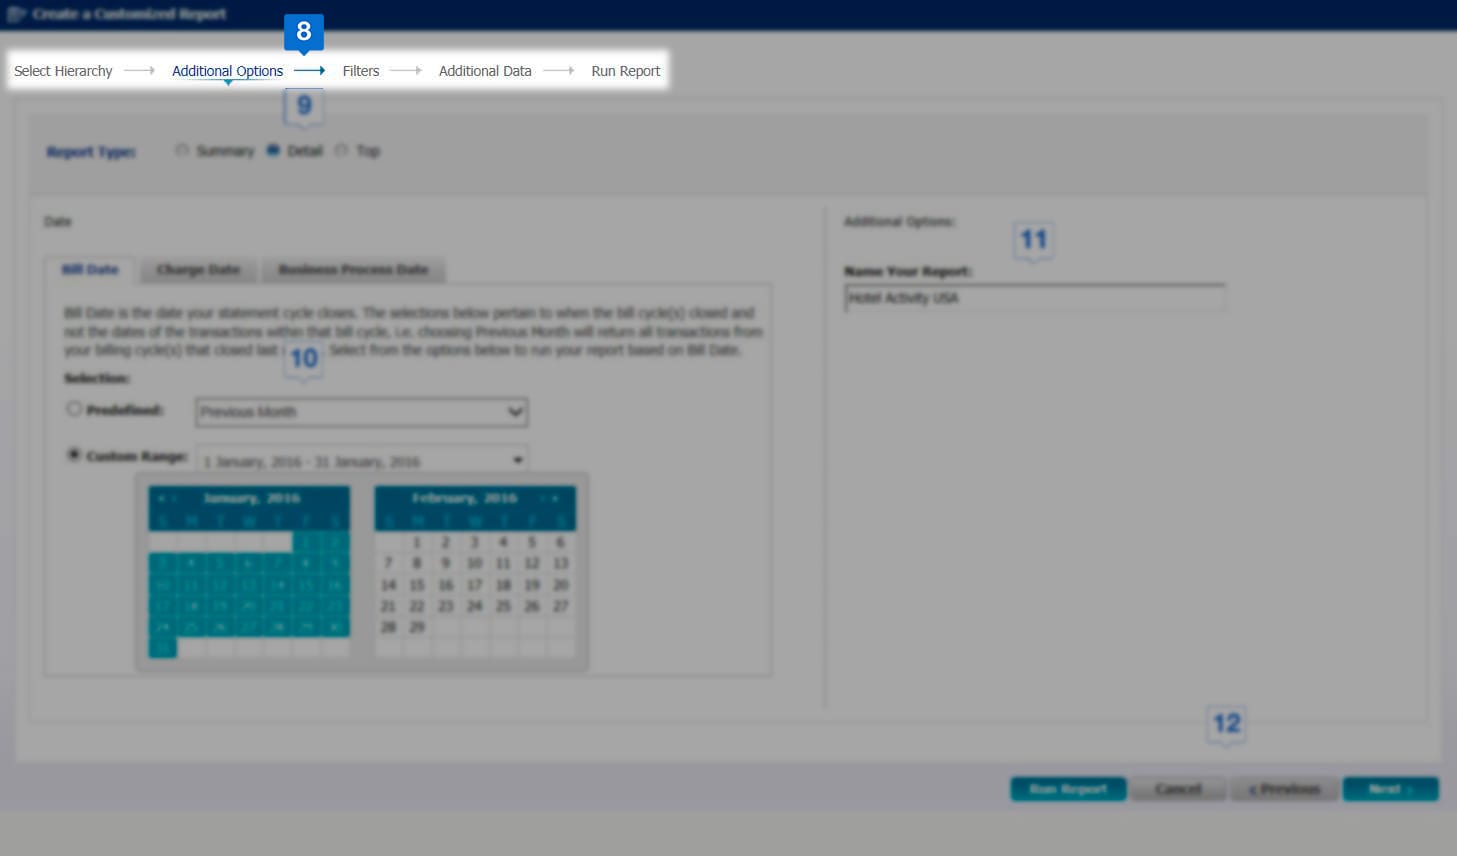

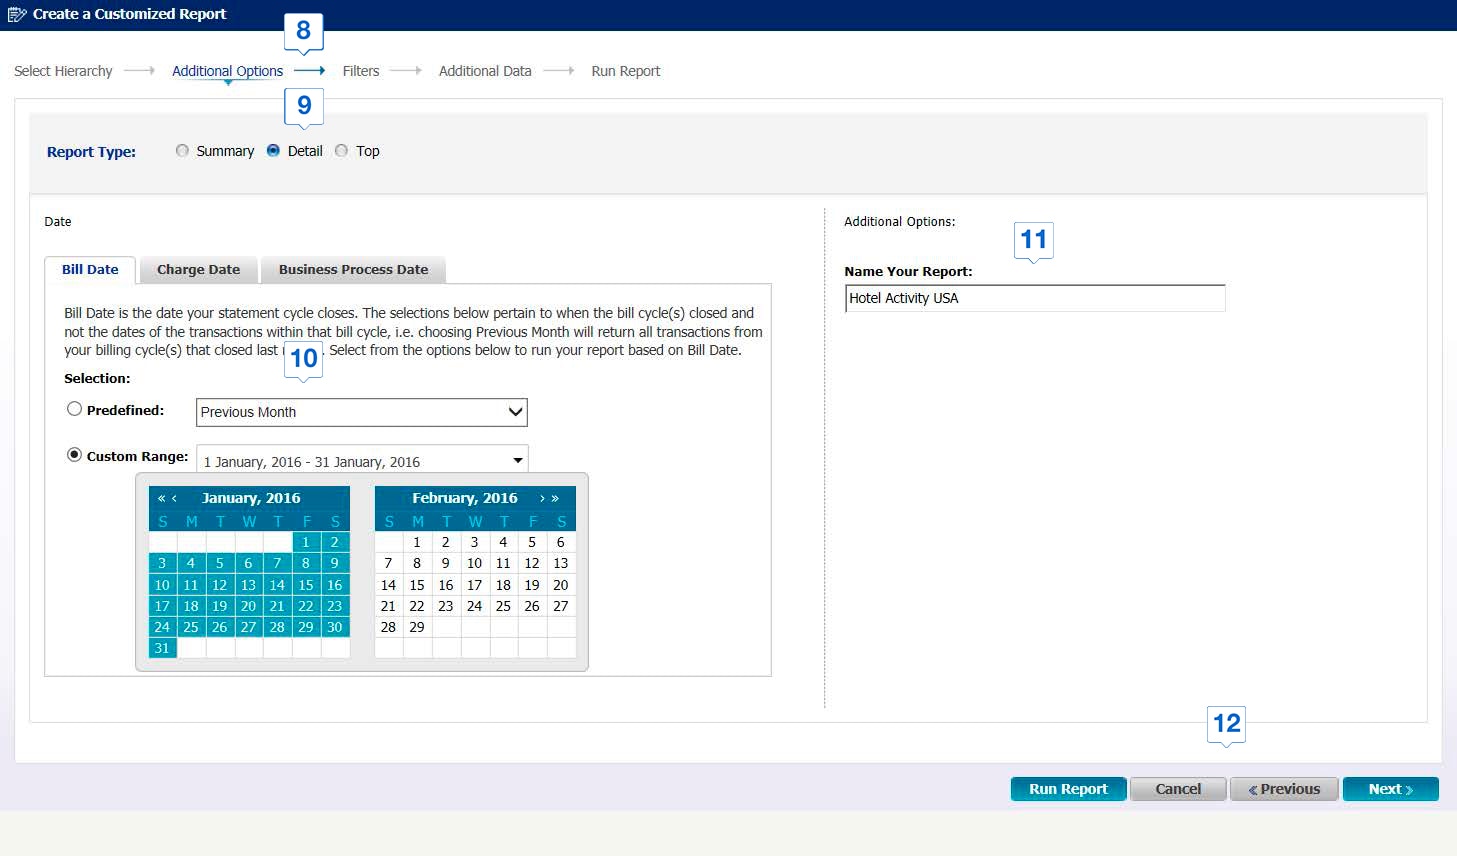
Follow the navigation path on the top of the screen to complete the steps to build your report.
-
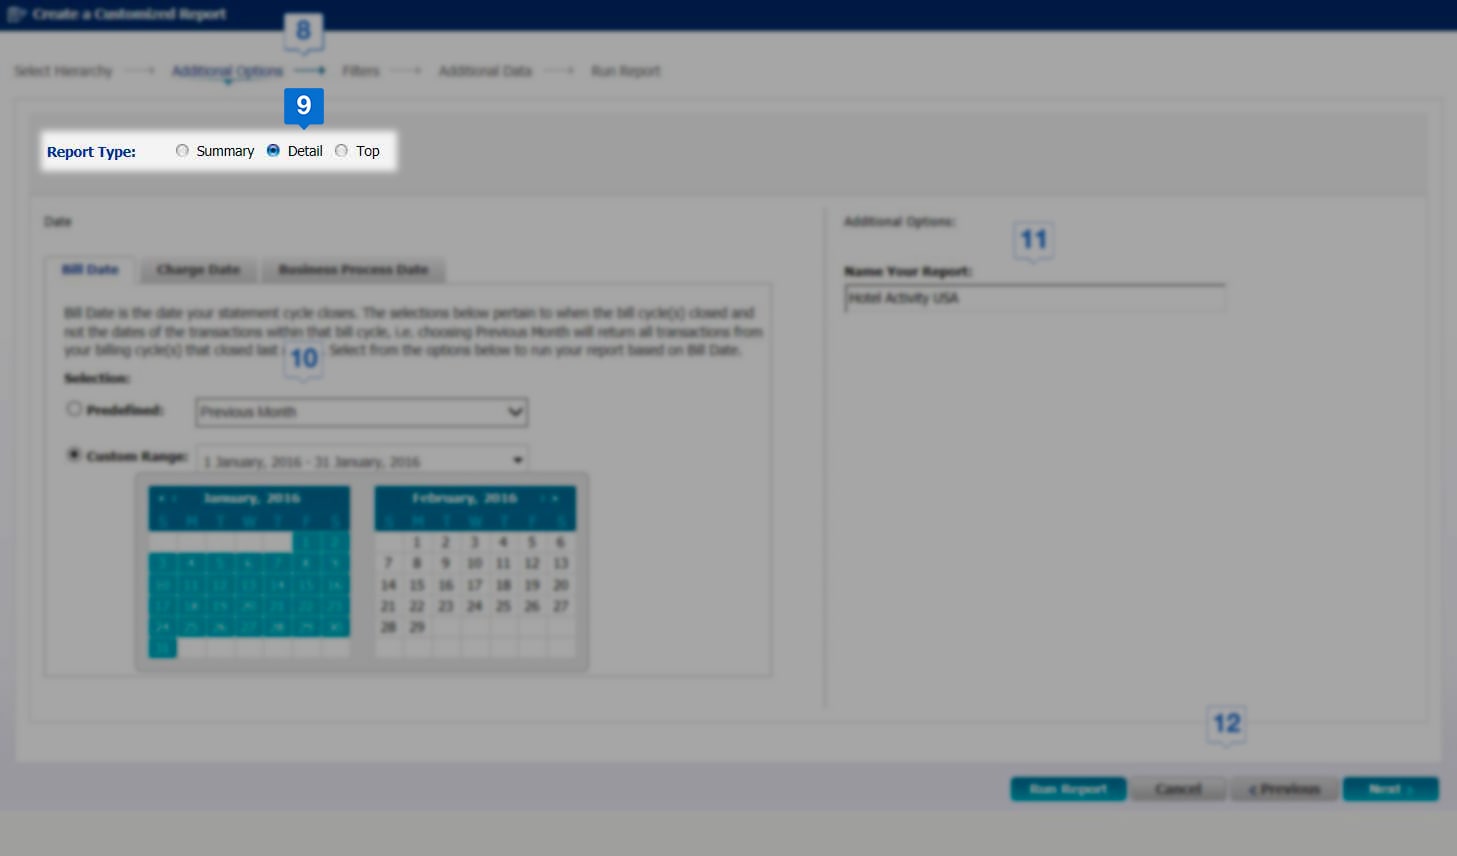

Some customized reports provide several views that may impact date, filters, and additional data options in the selection process.
-
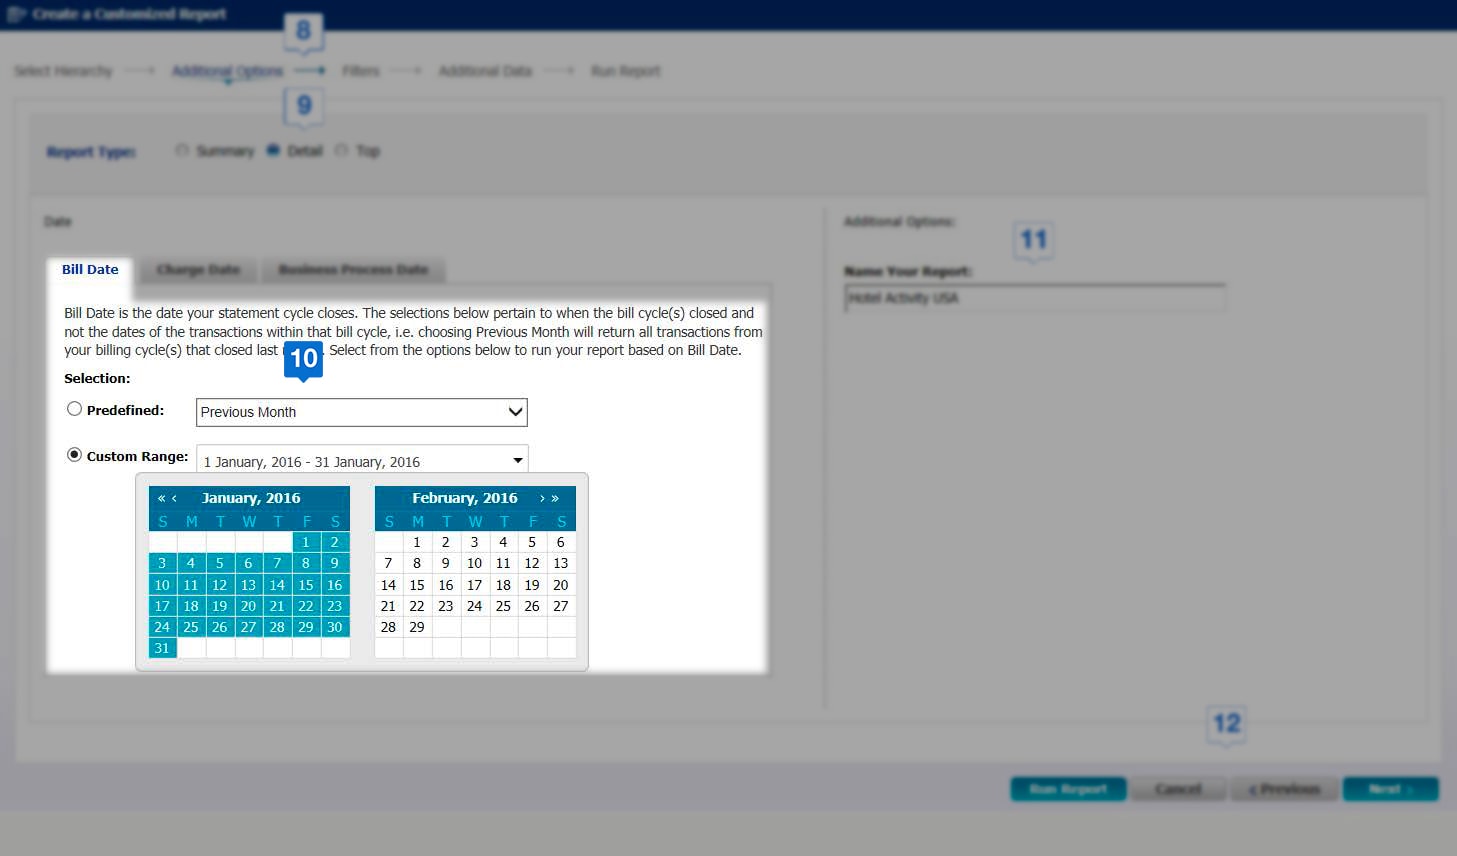

Select the timeframe for your report either by choosing a custom data range or a predefined date option.
-
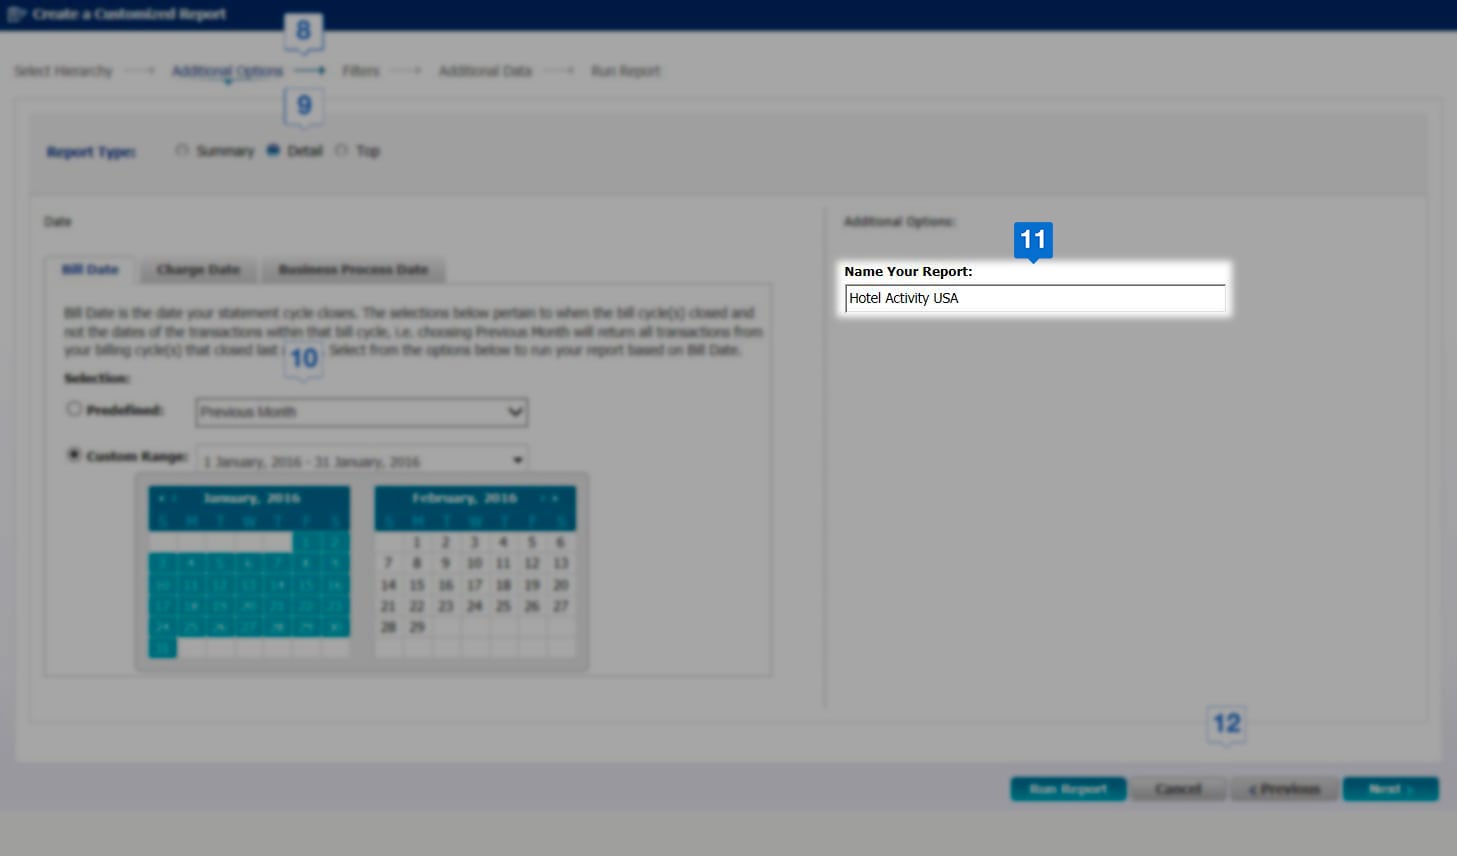

Update the name of your report for easier identification when it appears on the Available Reports.
-
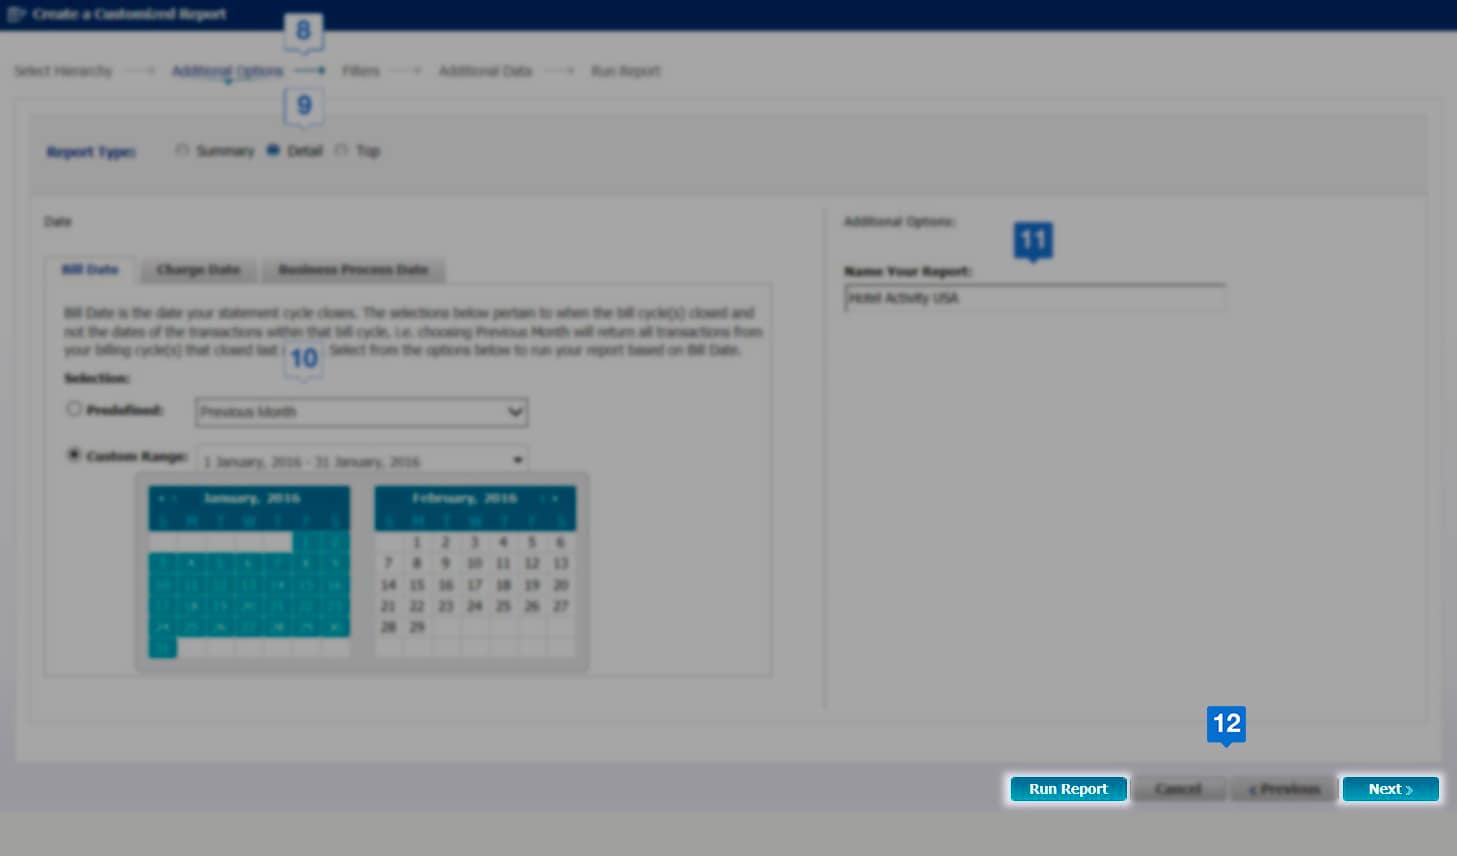

Click Next to customize your report and click Run Report to use default selections.
CREATE A CUSTOMIZED REPORT: FILTERS
Offers Carousel
-
-
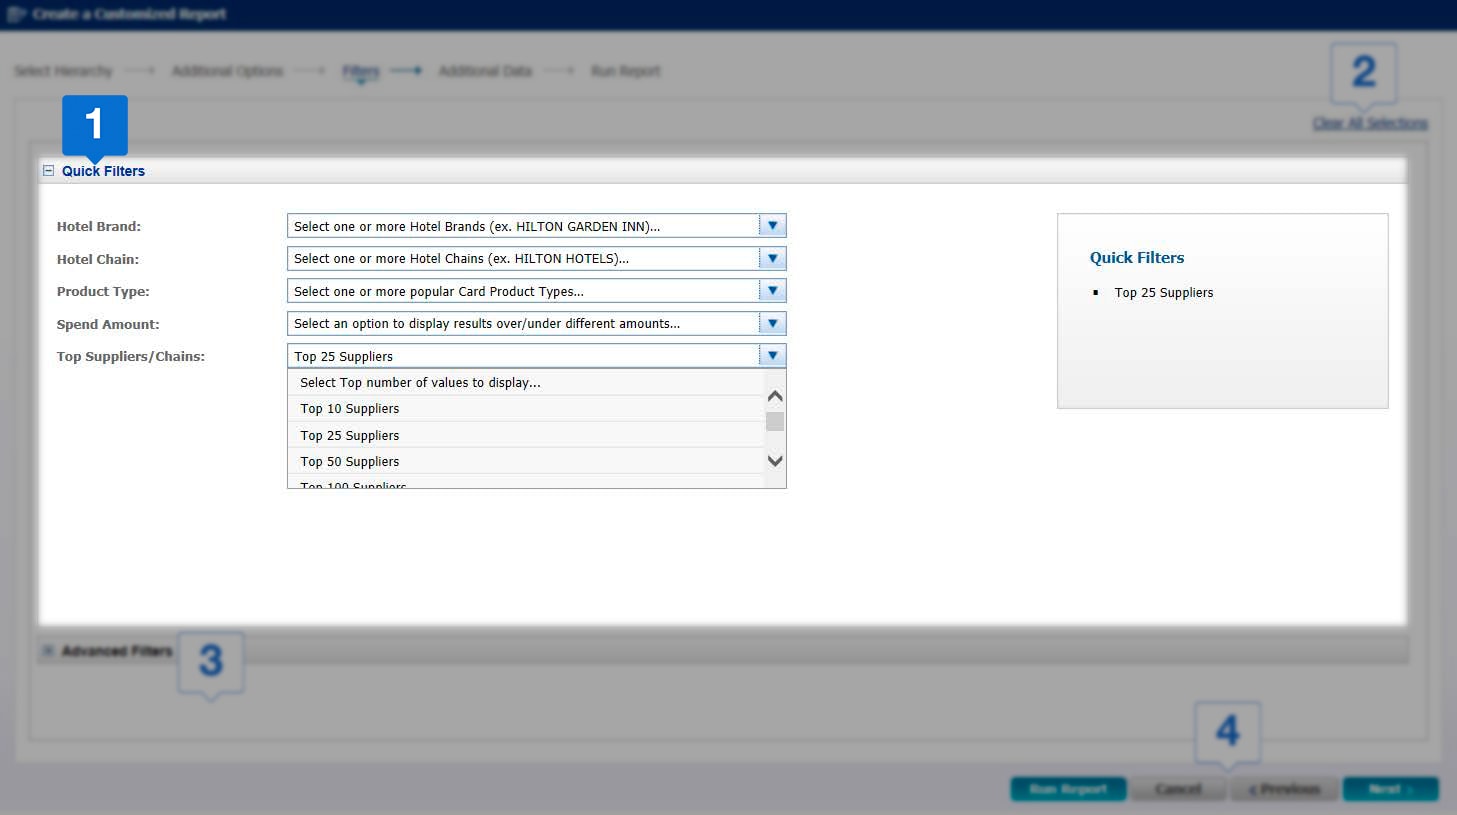
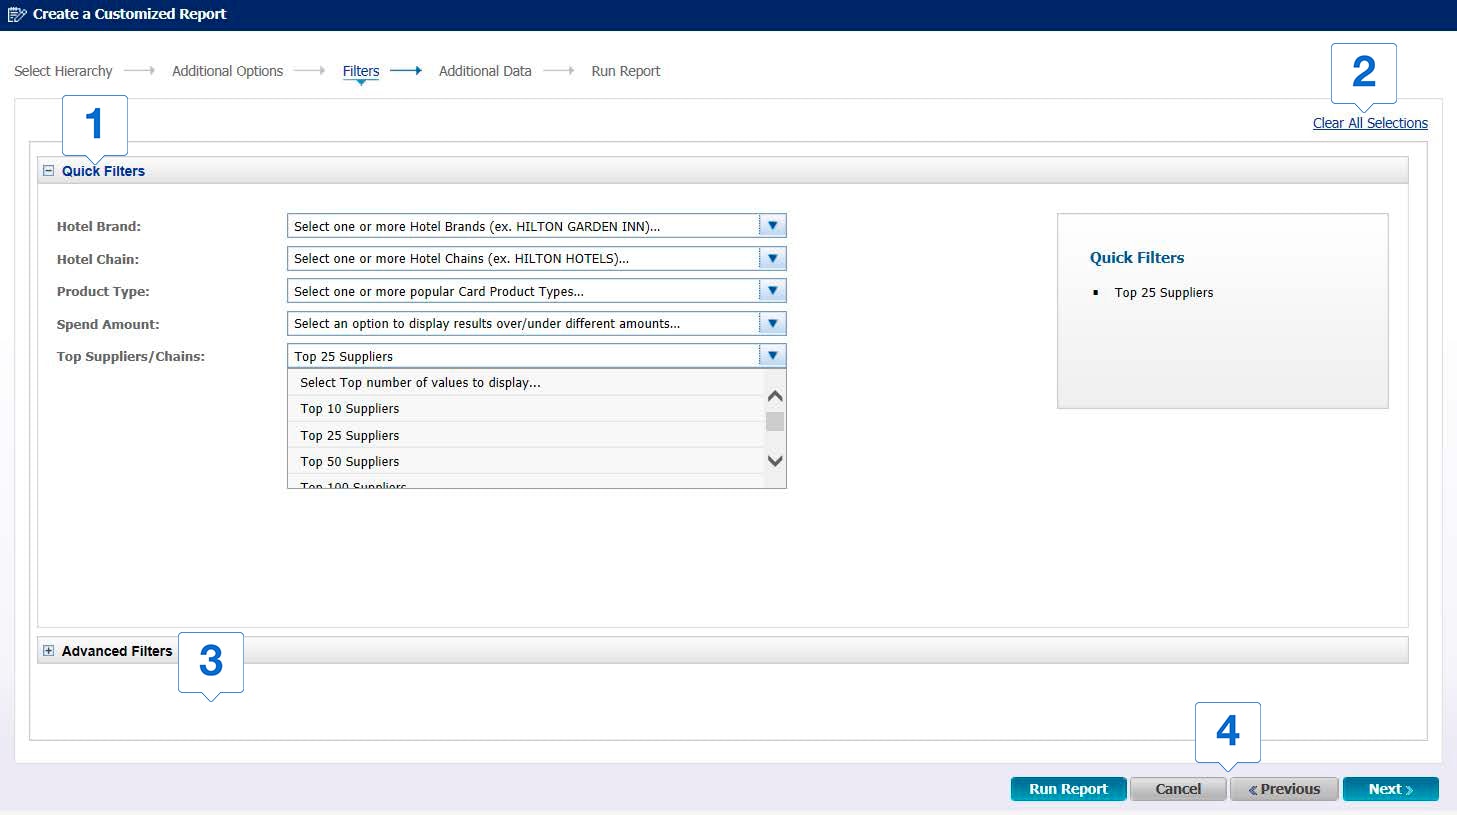
Use Quick Filters for the most common filtering options.
-
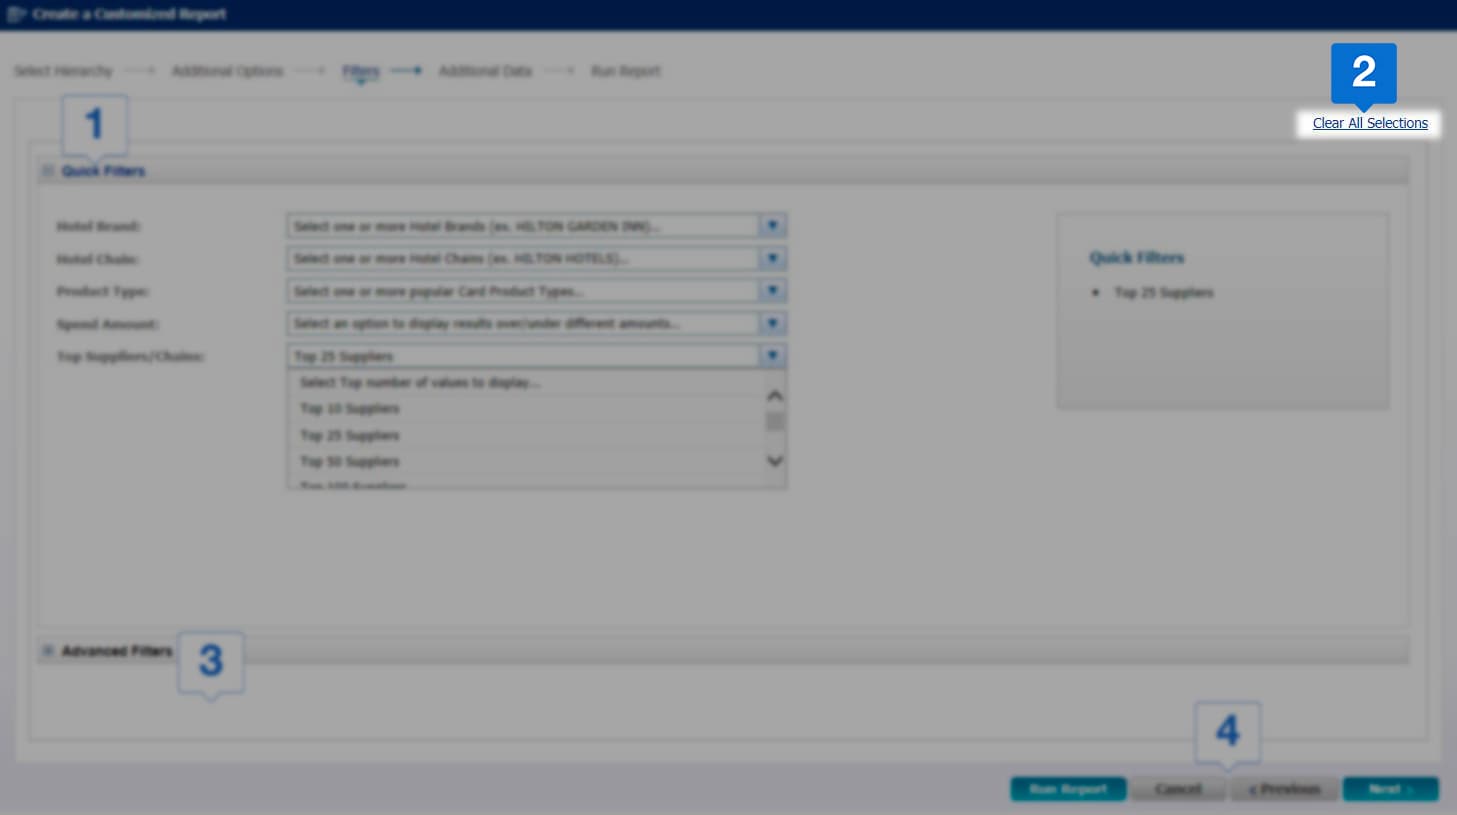
Use Clear All Selections button to remove all selections in this step and return to the default selections.
-
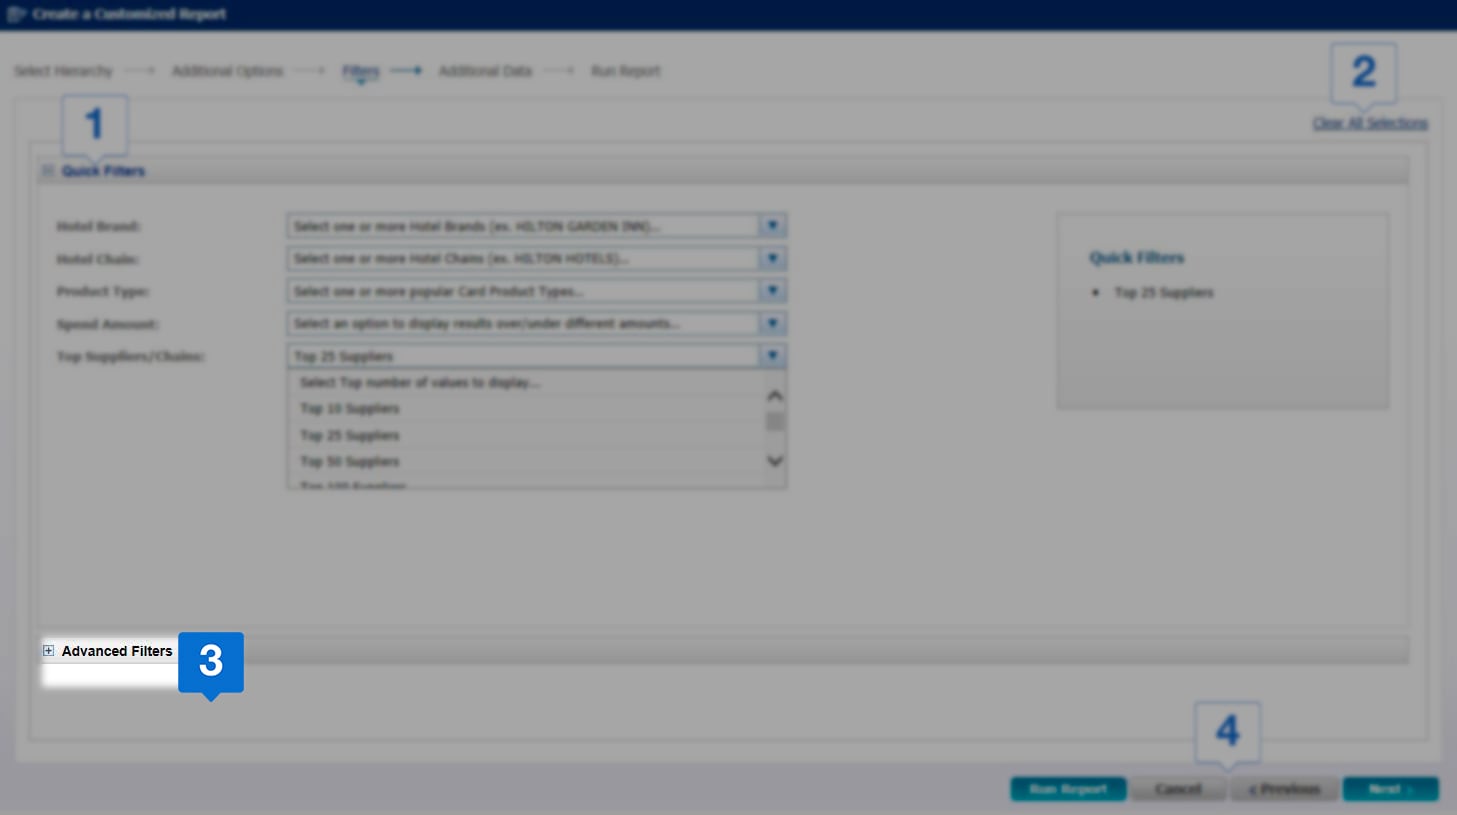
Use the Advanced Filter selections to choose more granular options.
-
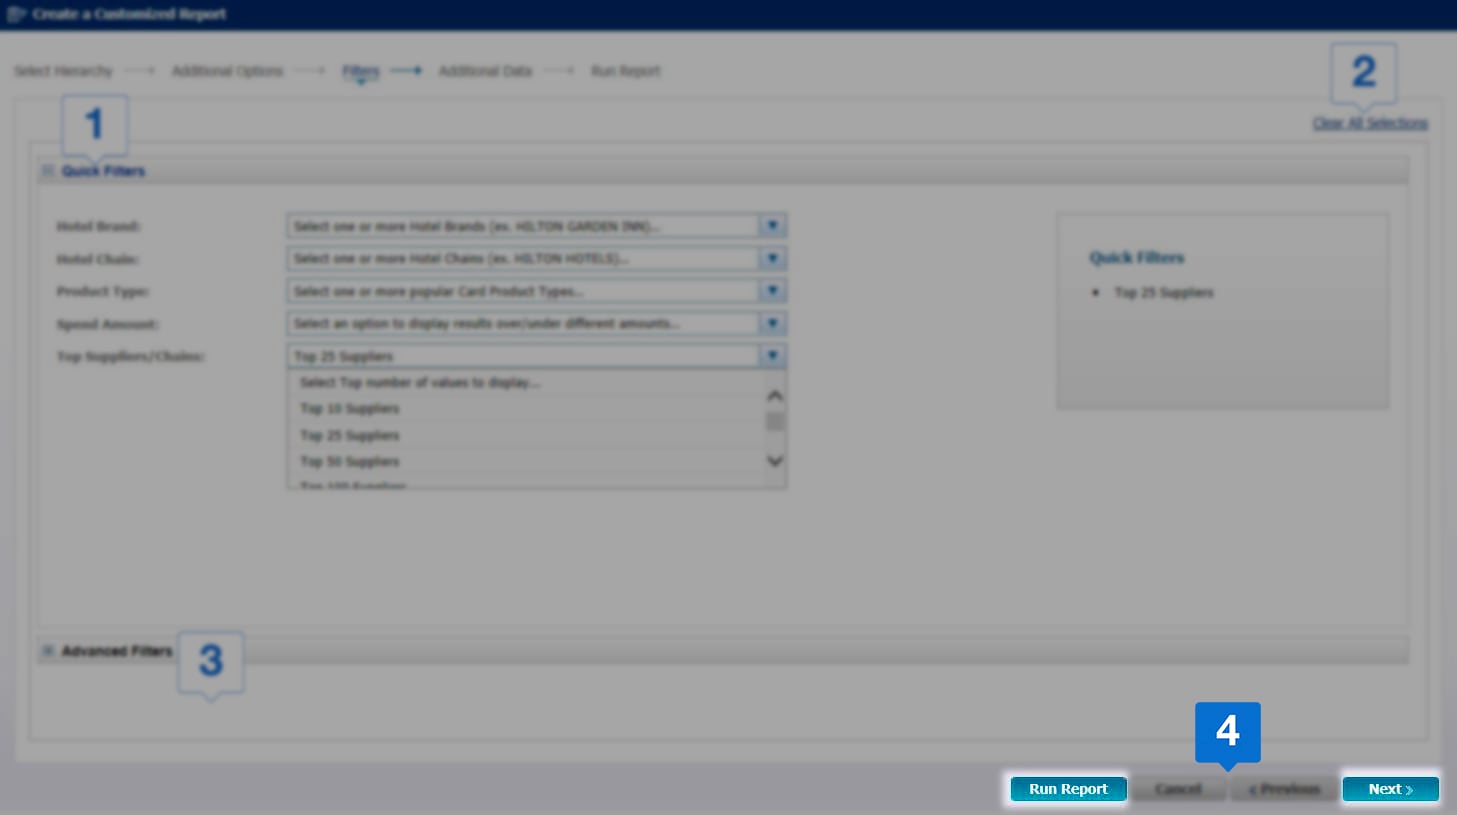
Click Next to customize your report and click Run Report to use the default selections.
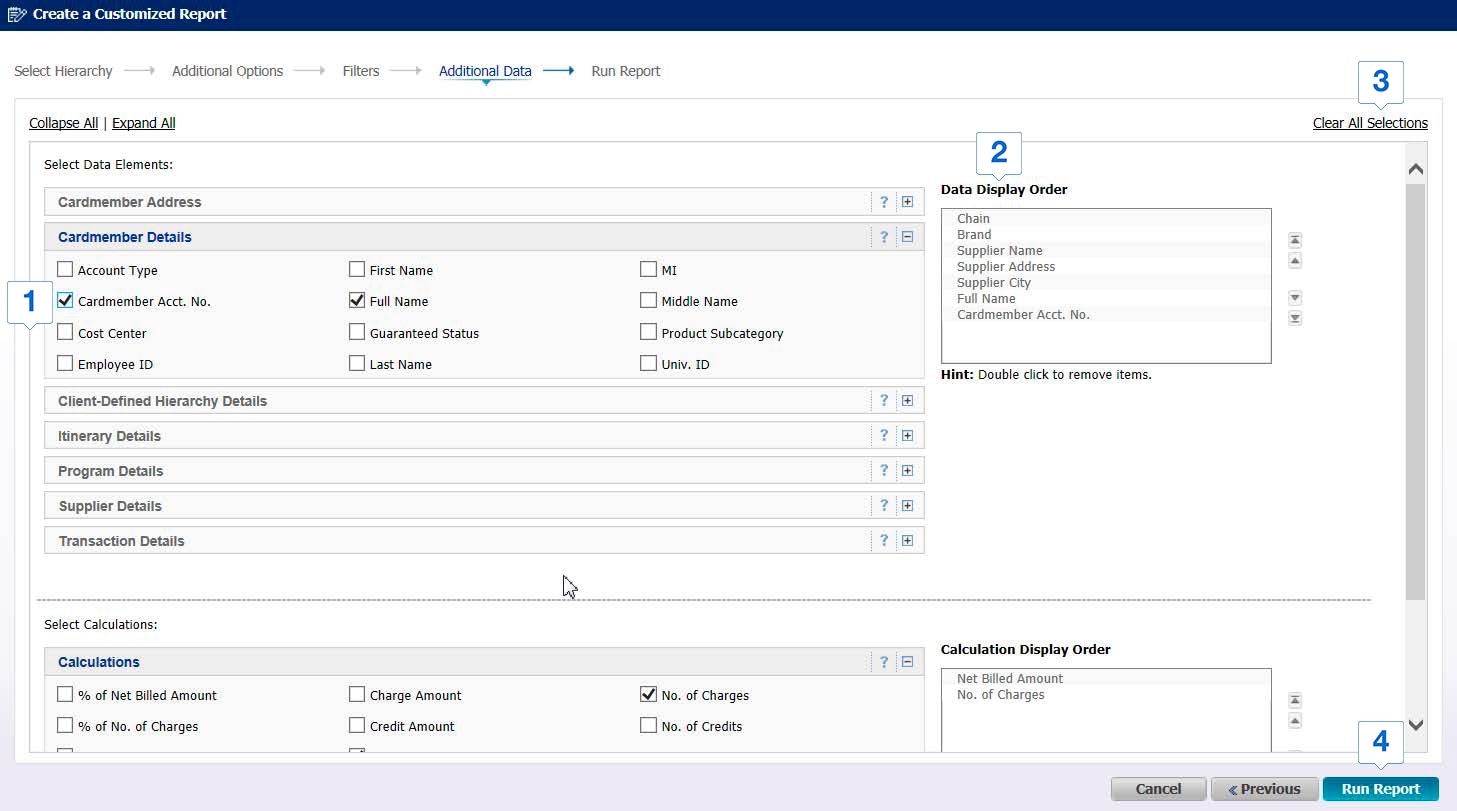
ADDITIONAL DATA
Offers Carousel
-
-
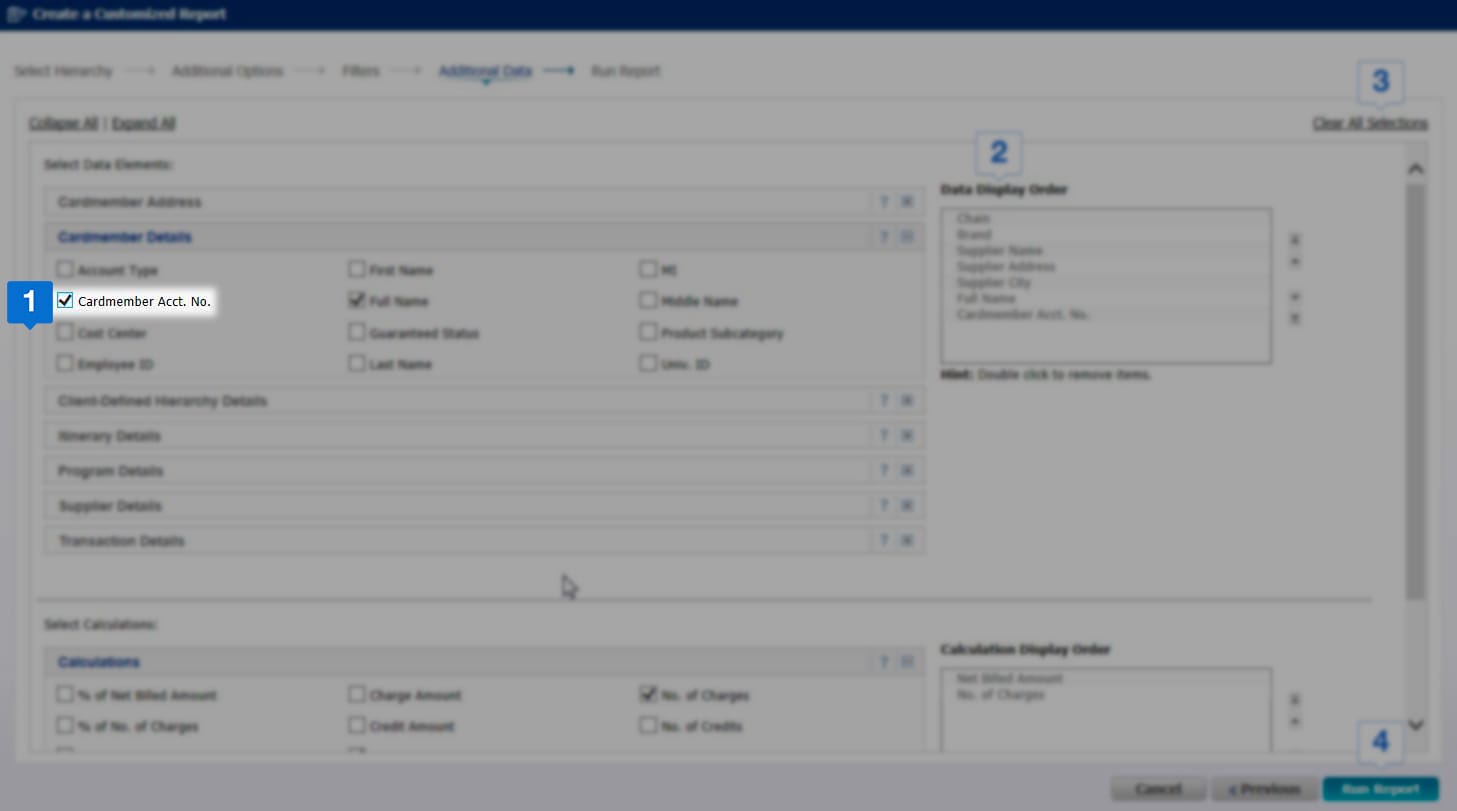
Use the check boxes to add or remove elements from your reports.
-
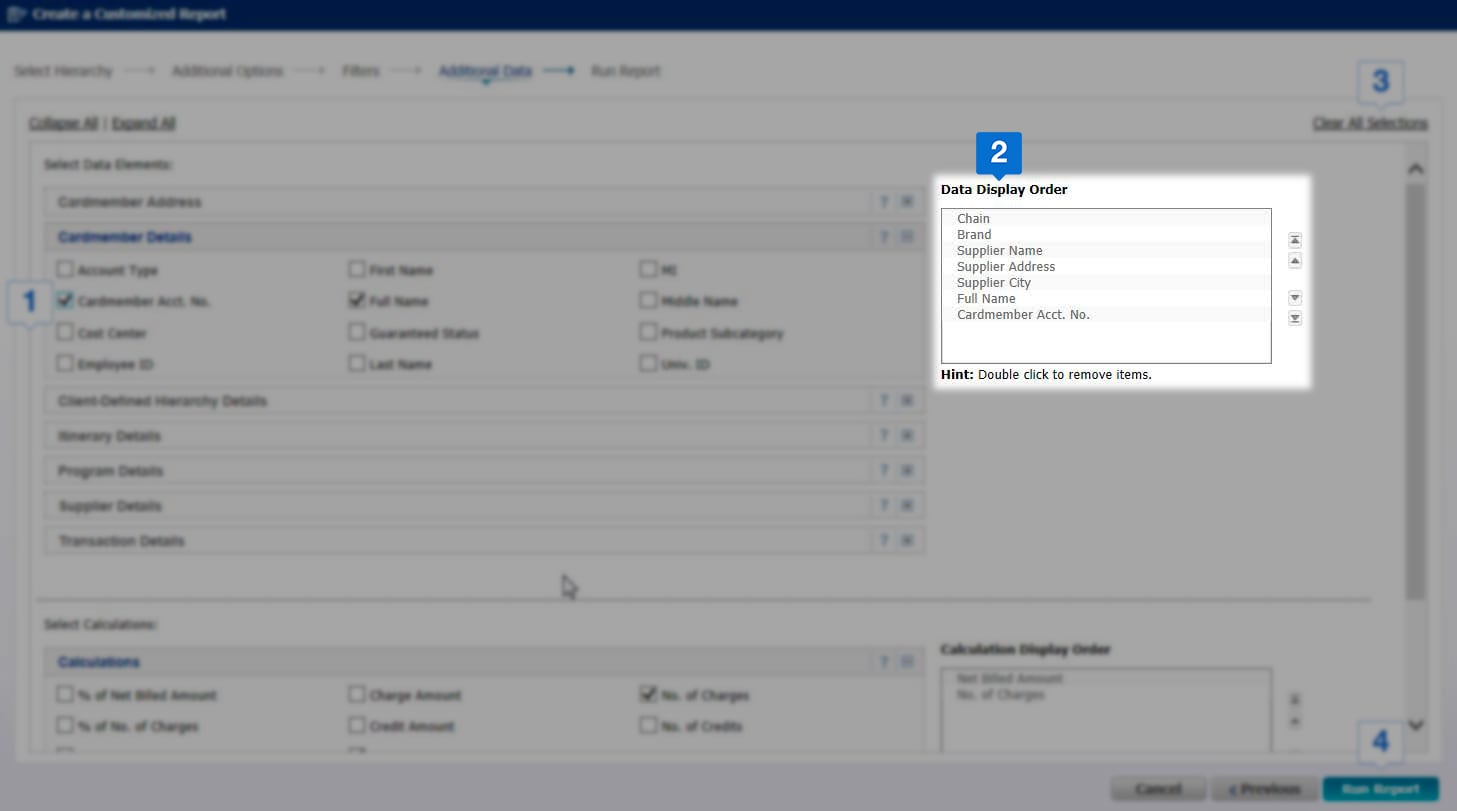
The Data Display Order and Calculation Display Order boxes show you the order the columns will appear on your report. Use arrows to the right of the boxes to change your column order.
-

Use the Clear All Selections button to remove all sections.
-
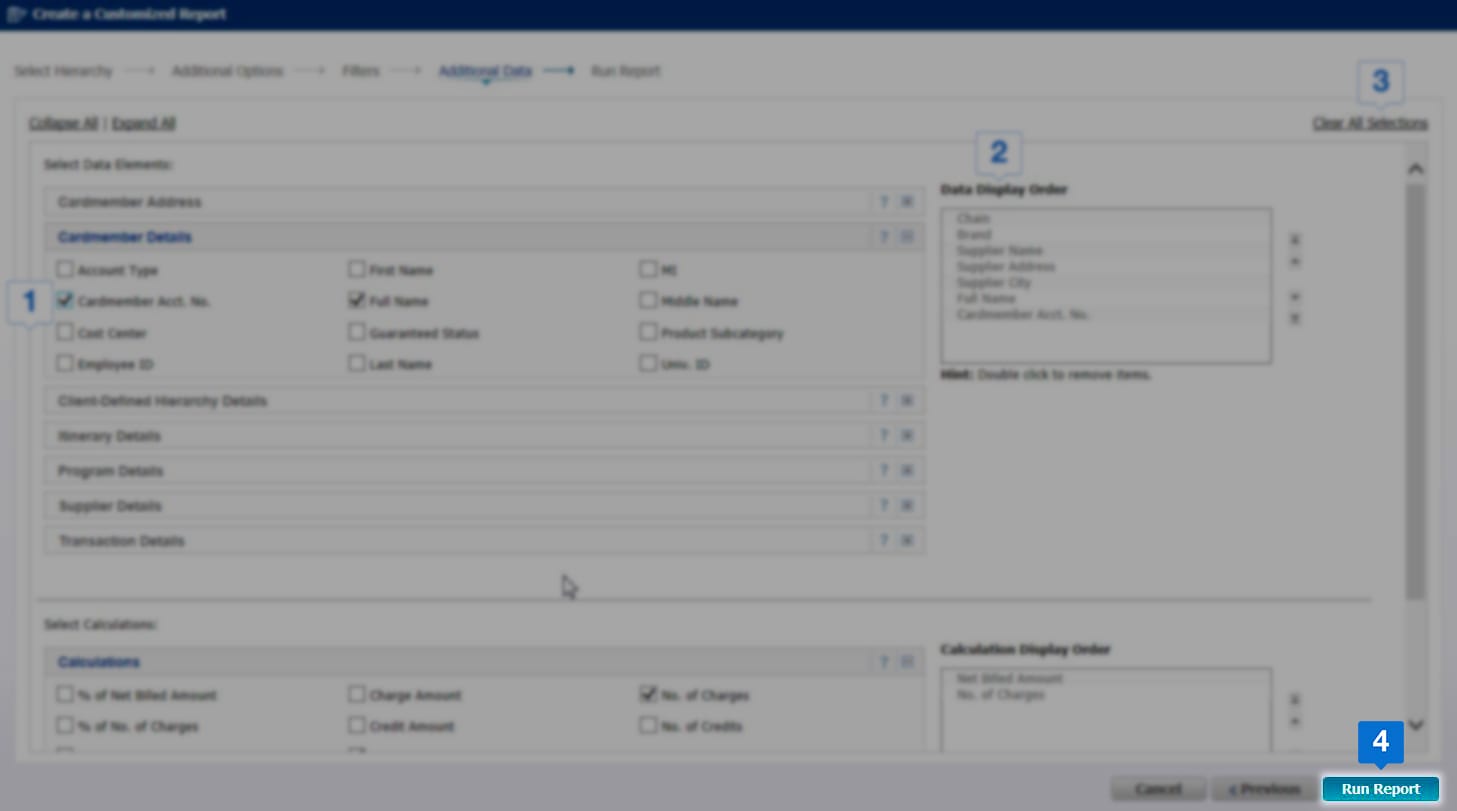
Once you have made your selections, click Run Report.
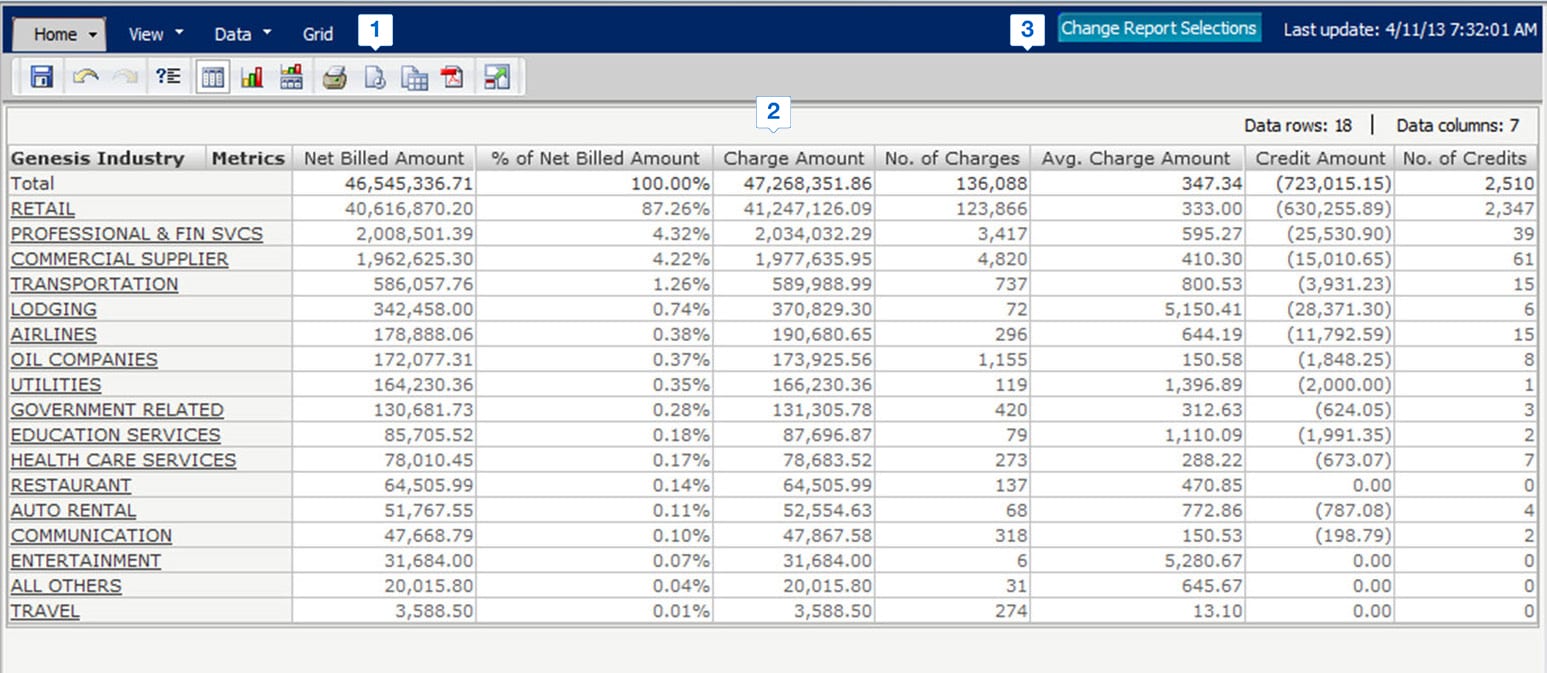
VIEW YOUR CUSTOMIZED REPORT RESULTS
Offers Carousel
-
-
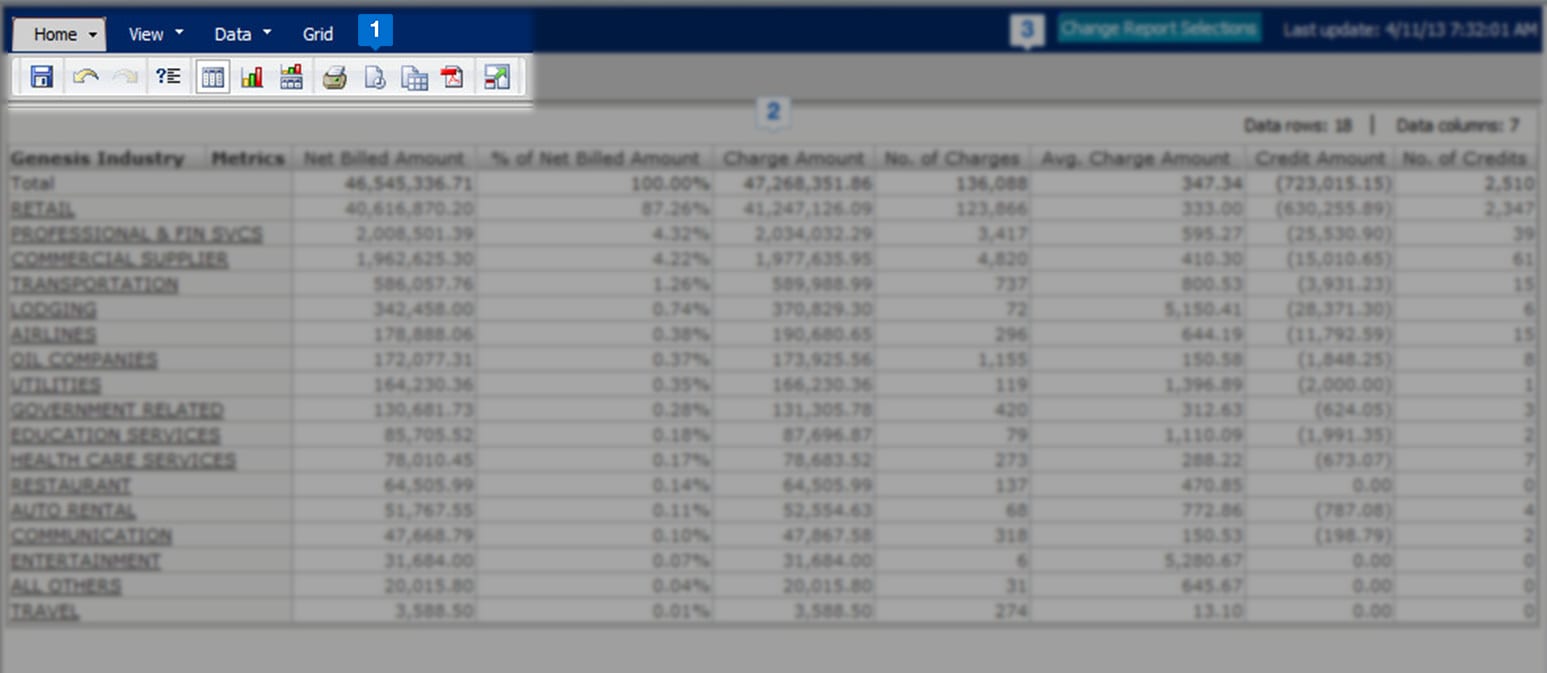
Use the Navigation bars to perform simple tasks such as sort columns, display in graph view, and export your report. Hover over each action to reveal tool tip text.
-
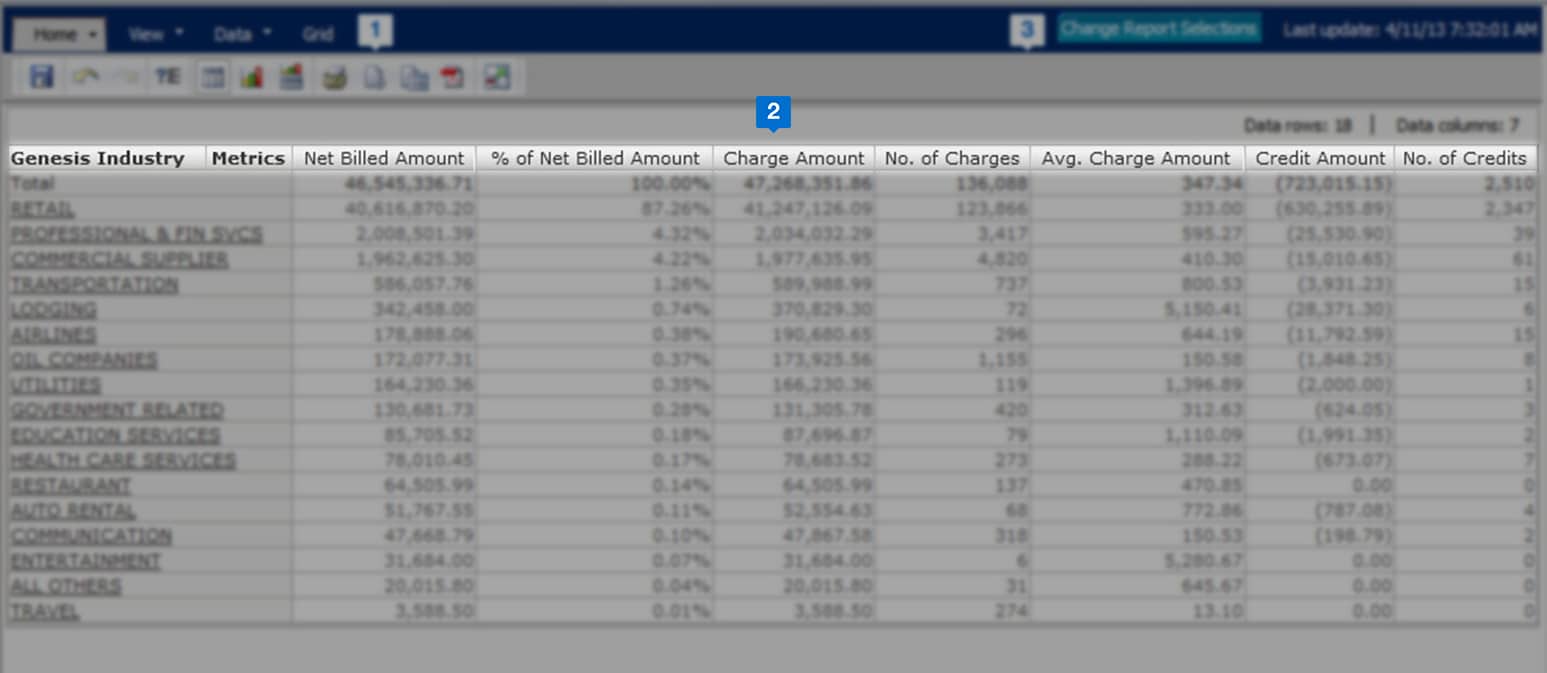
View your report results in an easy to read format. Click on column headers to sort columns, right click on column headers to view advanced functionalities. Click on hyperlinked data elements to drill further into your report data.
-
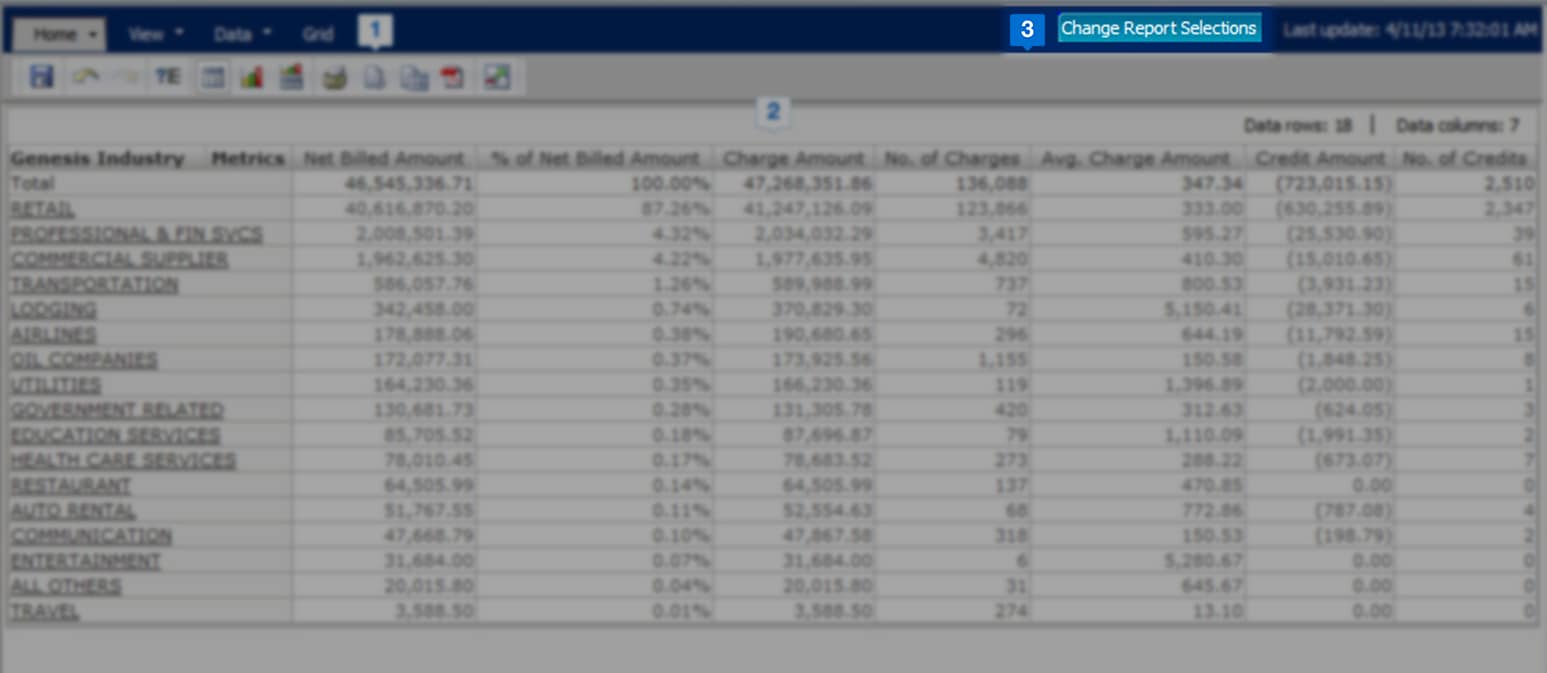
Use the Change Report Selections button to re-prompt your report and make changes to your report criteria.